Kymograph
A kymograph (from Greek κῦμα, swell or wave + γραφή, writing; also called a kymographion) is a type of two-dimensional plot that represents spatial position or signal intensity over time. In its modern usage, a kymograph is typically a space–time plot used in fields such as microscopy, cell biology, and speech science to track dynamic processes. These plots are generated by extracting intensity values along a predefined path across sequential image frames. The resulting image reduces the dimension to show time on one axis and sequential spatial information on the other. Using this technique allows for the visualization of dynamics within the image sequence, often by measuring the resulting slope of lines or streaks. This allows researchers to quantify velocity and directionality of movement, especially in applications like mitochondrial transport, vesicle trafficking, or vocal fold vibration. Although they reduce spatial information to a one-dimensional line, kymographs offer high temporal resolution and are often used alongside or in place of particle tracking techniques.
Kymograph device
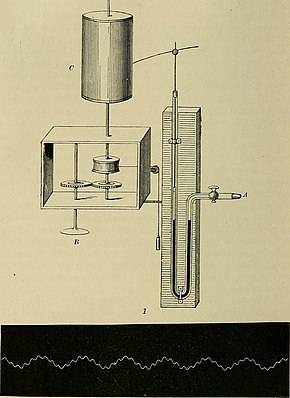
[edit]A kymograph is also an analog device that draws a graphical representation of spatial position over time. The graphical representation is a graph in which the y axis shows position and the x axis shows time. A kymograph consists of a revolving drum wrapped in paper on which a stylus draws to record measured changes of phenomena such as motion or pressure.[1][2]
| Kymograph | |
|---|---|
 Ludwig's kymograph. One limb of the manometer is connected to a stylus which writes on the kymograph. Below: kymograph recording | |
| MeSH | D007734 |
The kymograph was initially a mechanical and hydraulic device, invented by German physiologist Carl Ludwig in the 1840s, and found its first use as a means to monitor blood pressure. The blood pressure was conveyed by hydraulics and levers to move a stylus that scratched a white trace into soot-covered paper on the revolving drum. Time is represented by the drum's rotation rate, and was recorded by a second stylus driven by a clock or tuning fork. The kymograph almost immediately became the central instrument in physiology and physiology education. Throughout the nineteenth and twentieth centuries, researchers and technicians devised many improvements to the device, plus numerous new sensory components to measure a wide range of physiological phenomena such as breathing, muscle movement, and speech. New detection and registration systems included electrical and electronic methods, and plotted in ink.[3]
Kymographs were also used outside medical science to measure atmospheric pressure, tuning fork vibrations, the functioning of steam engines, animal habits, and the movement of molecules in cells.
Kymography in Experimental Physiology
[edit]The kymograph is generally used to study the effects of xenobiotics on tissue preparations. It is a standalone recording apparatus used alongside other apparatuses such as organ baths. Writing levers are used to trace the recording from muscle contractions. Some of the commonly used writing levers are the simple lever, the frontal writing lever and the starling heart lever. These writing levers are connected to a fulcrum which is found on a secondary apparatus.[4]
Videokymography
[edit]Videokymography is a high-speed imaging method used to examine vocal fold vibrations. It is a one-dimensional version of high-speed video imaging that captures images from a single transverse line across the glottis. These line images are recorded in rapid succession and displayed in real time with the vertical axis representing time. The resulting kymogram shows mucosal wave motion, glottal opening and closing, periodicity, and symmetry of vocal fold vibration. This method is particularly useful for detecting pathologies that alter vibratory patterns, such as vocal fold nodules or polyps. Modern systems often integrate videokymographs with endoscopic views to allow simultaneous structural and dynamic visualization.[5]
Depth Kymography
[edit]Depth kymography extends traditional kymographic analysis into three dimensions by incorporating depth-resolved imaging techniques such as optical coherence tomography. In this method, vertical sections of tissue (commonly vocal folds) are captured over time to create a dynamic depth-resolved kymogram. It allows for simultaneous visualization of surface and sub-surface vibration, offering enhanced diagnostic capability in laryngeal studies. This technology provides a comprehensive view of biomechanical motion within layered tissue structures.
See also
[edit]References
[edit]- ^ University of Toronto Scientific Instruments Collection. "Vertical Kymograph". www.psych.utoronto.ca. Archived from the original on 2008-12-11. Retrieved 2017-04-29.
- ^ Science Museum. "Kymograph, London, England, 1925-1935". Archived from the original on 2017-04-05. Retrieved 2017-04-29.
- ^ Kwan, Alistair (2016). ""Do not kill guinea pig before setting up apparatus": the kymograph's lost educational context". Teorie Vědy. 38: 301–335.
- ^ M.N. Ghosh; J.R. Vedasiromoni (2015). Fundamentals of experimental pharmacology (Sixth ed.). Kolkata. ISBN 978-8190296502. OCLC 949350586.
{{cite book}}: CS1 maint: location missing publisher (link) CS1 maint: multiple names: authors list (link) - ^ Itamura, Kyohei et al. (2023). "Laryngeal Imaging." In: Otolaryngologic Clinics of North America.
